
Example Picks
Here are the picks for Week 1, 2025 to use as an example:
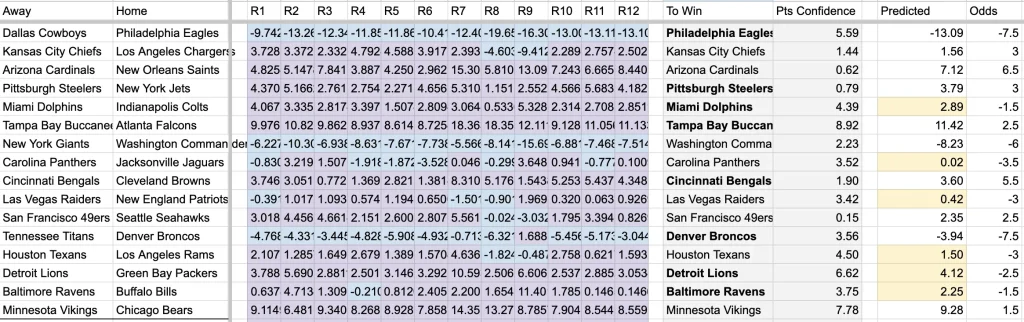
Matchups
Each row represents a single game for the week. The Away team is listed on the left and the Home team on the right.
Model Runs (R1–R12)
The columns labeled R1 through R12 show the results of twelve different “runs” of the model.
- Each run uses slightly different inputs and strategies.
- This allows you to see how consistent the model is.
- If most runs point strongly in one direction, that’s a stable signal. If some runs swing the other way, it suggests more uncertainty or outlier strategies.
To Win
This column shows the team the model is picking to win.
- If the team name is in bold, it means Jeremy is also personally confidently picking that team to win.
- This gives you a sense of where human intuition and the AI model align.
- We often will bet 3-4 team moneyline parlays using the bolded teams.
Confidence
The Pts Confidence column shows how strongly the pick compares to the official betting line.
- It is the difference between the spread and the model’s predicted margin.
- A higher number means a stronger pick — more likely to cover the spread.
- A lower number means the model sees it as closer to a coin flip.
Predicted Margin of Victory
The Predicted column shows the model’s average expected margin of victory across all runs. This is the key output from the model.
- A negative number means the away team is expected to win by that many points.
- A positive number means the home team is expected to win by that many points.
- A highlighted number means the model is picking the underdog to win outright. These are often the most interesting picks.
Odds (The Betting Line)
The Odds column lists the official point spread, based on DraftKings numbers. These numbers are typically set on Tuesday’s each week and may not represent the latest numbers.
- A negative number means the home team is favored and must win by at least that many points to cover.
- A positive number means the home team is an underdog and can lose by that amount (or win outright) and still cover.
Example: If the Odds show -7.5, the home team must win by at least 8 points to cover. If it shows +3, the home team can lose by up to 3 points (or win) and still cover. (Typically your sports book will give you your bet back in the case of “a push” where a team ties when taking the spread into account.)
Putting It All Together
When reviewing the picks:
- Scan the R1–R12 runs to check consistency.
- Look at the Bet On column to see which side the model favors.
- Check Confidence to judge the strength of the pick.
- Use Predicted Margin to see if the model expects a close game or a blowout.
- Compare to Odds to understand how the model’s prediction lines up with the sportsbook.
👉 In short: the higher the confidence and the more consistent the runs, the stronger the bet.